free
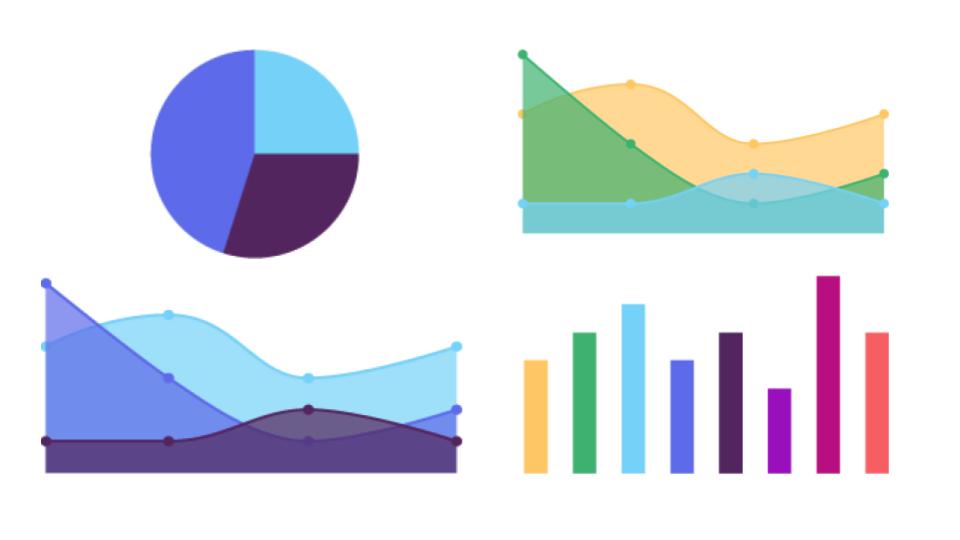
Create line charts, bar charts, treemaps or donut charts. For the web or for printing.
free
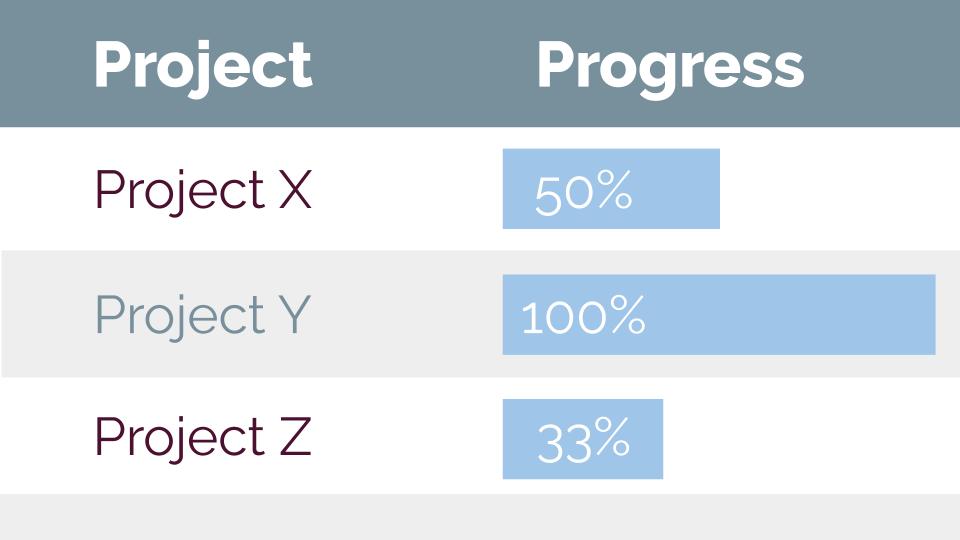
Make interactive data tables. Includes color and size customization for table categories and numbers.
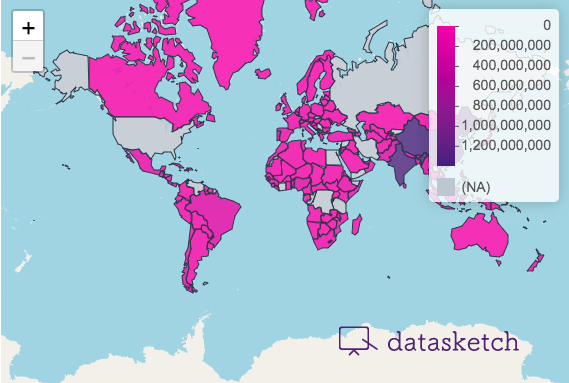
Create maps of the world and of countries at different administrative levels.
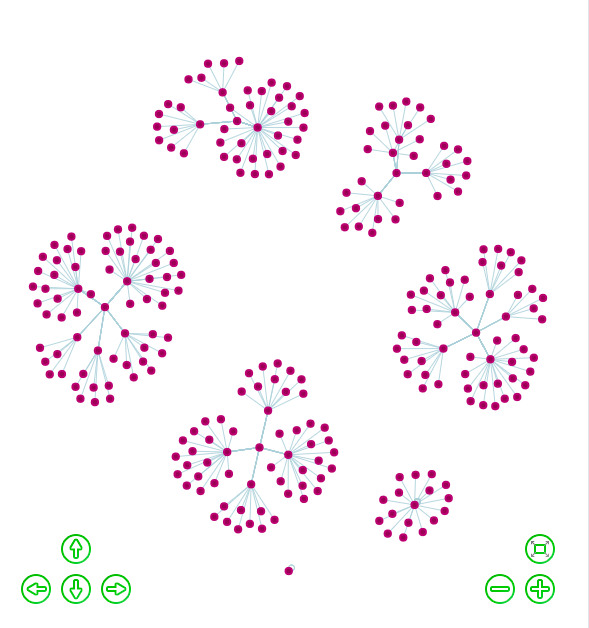
Create interactive network visualizations with customizable nodes and edges.
free
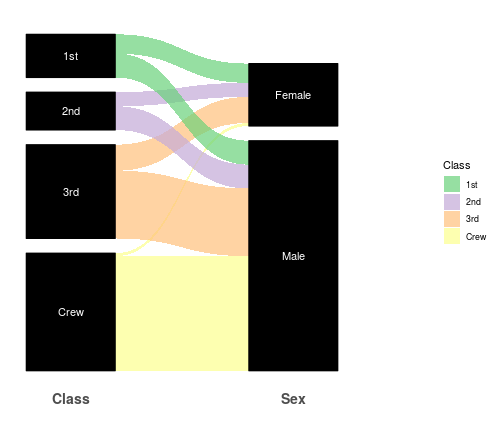
Create Sankey diagrams, also known as Parallel coordinates. Used to better represent flows between categories.
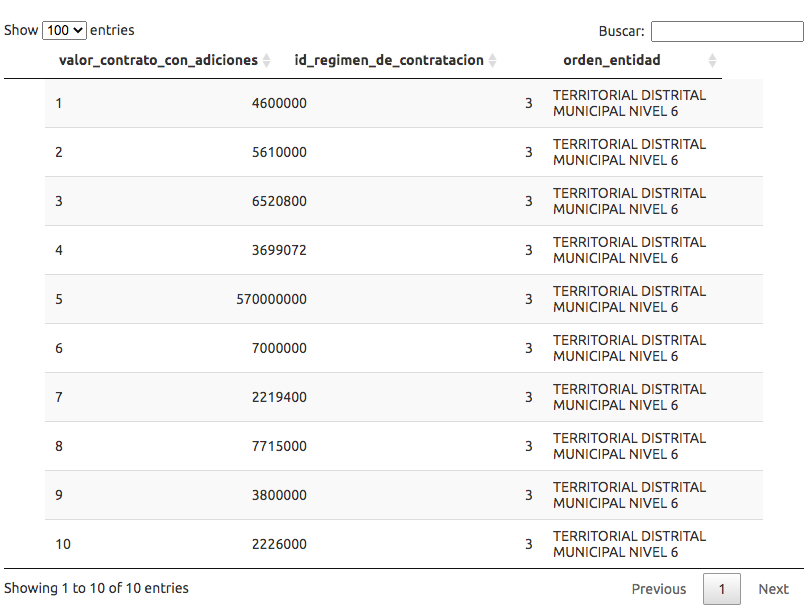
Access SECOP, Colombia’s public spending registry and one of its most important databases.